December Mortgage Rates Lowest In 7 Years- Real Estate Slump?
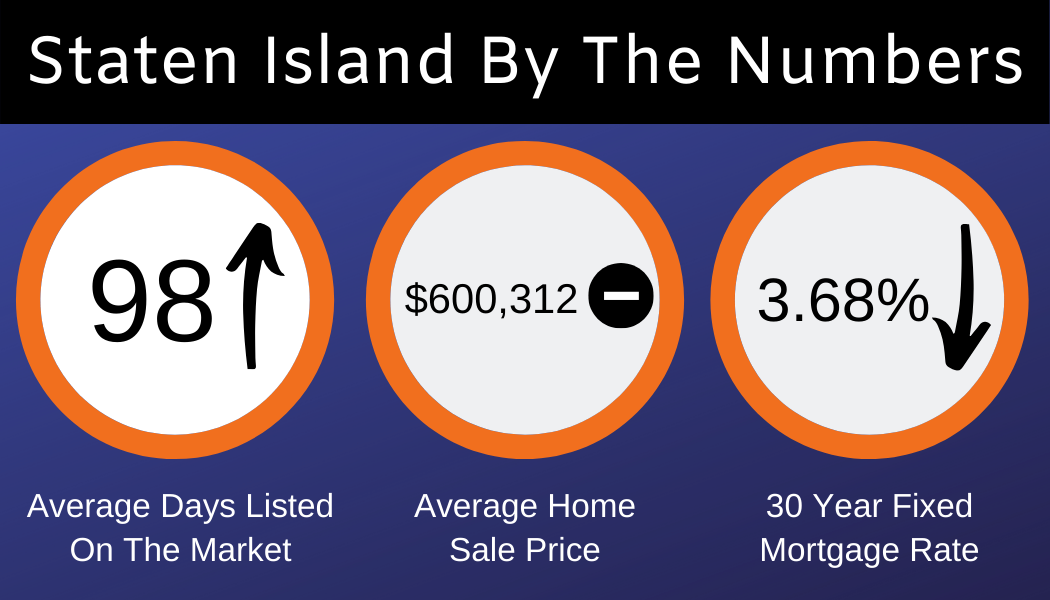

With current mortgage rates the lowest this month than every December since 2012, the tail end of the housing crisis, we must assume that home sales are on the wane nationally. A 30-year mortgage now averages 3.68%.
When mortgage rates fall, it typically means that home buyers need extra incentive. In December of last year, the average was 4.75%. A full point drop could amount to hundreds saved per month. On a national level, sales have slumped in many key areas due to the high cost of living among other factors.
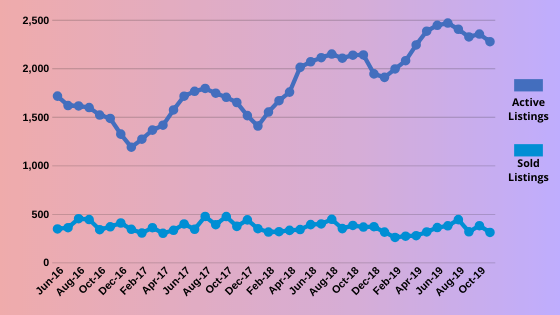
In Staten Island, sales have fallen 15% since last year. We closed out the month of November with just 312 sales. Last year, 369 homes sold in November. Active inventory is up as well by 6% from 2,143 to 2,276. Homes are also taking longer to sell, with days on the market now up to 98. Last year, this was a full 24% lower at 79 days!
However, new listings are down from last year as well. Last month just 423 homes were listed, compared to 463 last year (a 9% drop). We might conclude that people are starting to understand selling has become more difficult. This is also reflected in the new list prices falling. The new average list price is $653,213. This is actually up since last month, but down 3.6% from April 2019’s high of $677,612.
And finally, how much are homes selling for now? November’s average home sale price came up a little to $599,589, but the price increase since last month is not significant. The average price has plateaued around $600k since summer. Sold-to-list ratio has similarly plateaued at the mid-96 point range ever since last spring. Homes sold for 96.5% of their list price in November.
So to summarize: prices have stalled but not fallen, list prices have gone down, and the sold-to-list ratio has also stalled. Of the price metrics, the best leading indicator is the new list price. Sold prices and sold-to-list ratios are more reflective of the market a few months ago when these homes went into acceptance. Therefore, the lower list prices signal a growing acceptance that sellers need to sweeten the deal for buyers in order to get the home sold.
What to make of the volume and inventory data: sales are down, homes are taking longer to sell, and active listings are up. The real estate market has begun tipping in buyers’ favor. But all the hot investment buzz around the New York Metro has kept prices high.
So rather than a true slowdown, we have more of a stalling in the market. This could be a cause for concern on the seller’s side with sales so low, and also because a plateau could mean the beginning of the end. But sellers also shouldn’t fret either based on what we see. Selling sooner rather than later would probably maximize your investment, but none of these indicators point to a market crash. And remember that if you buy within the same market you sold your home in, prices are likely to fall for you too when it comes time to purchase something new.
And things are looking up for buyers! With home affordability such a squeeze right now, stagnant prices are a relief, particularly for first-time buyers. Of course, the best Christmas present is a low mortgage rate; the gift that keeps on giving.