Strong Prices Remain – But Will Your House Sell At All? November Market Snapshot


 Home prices hold steady, but so does the trend in rising inventory. When the supply for housing goes up, demand naturally wanes.
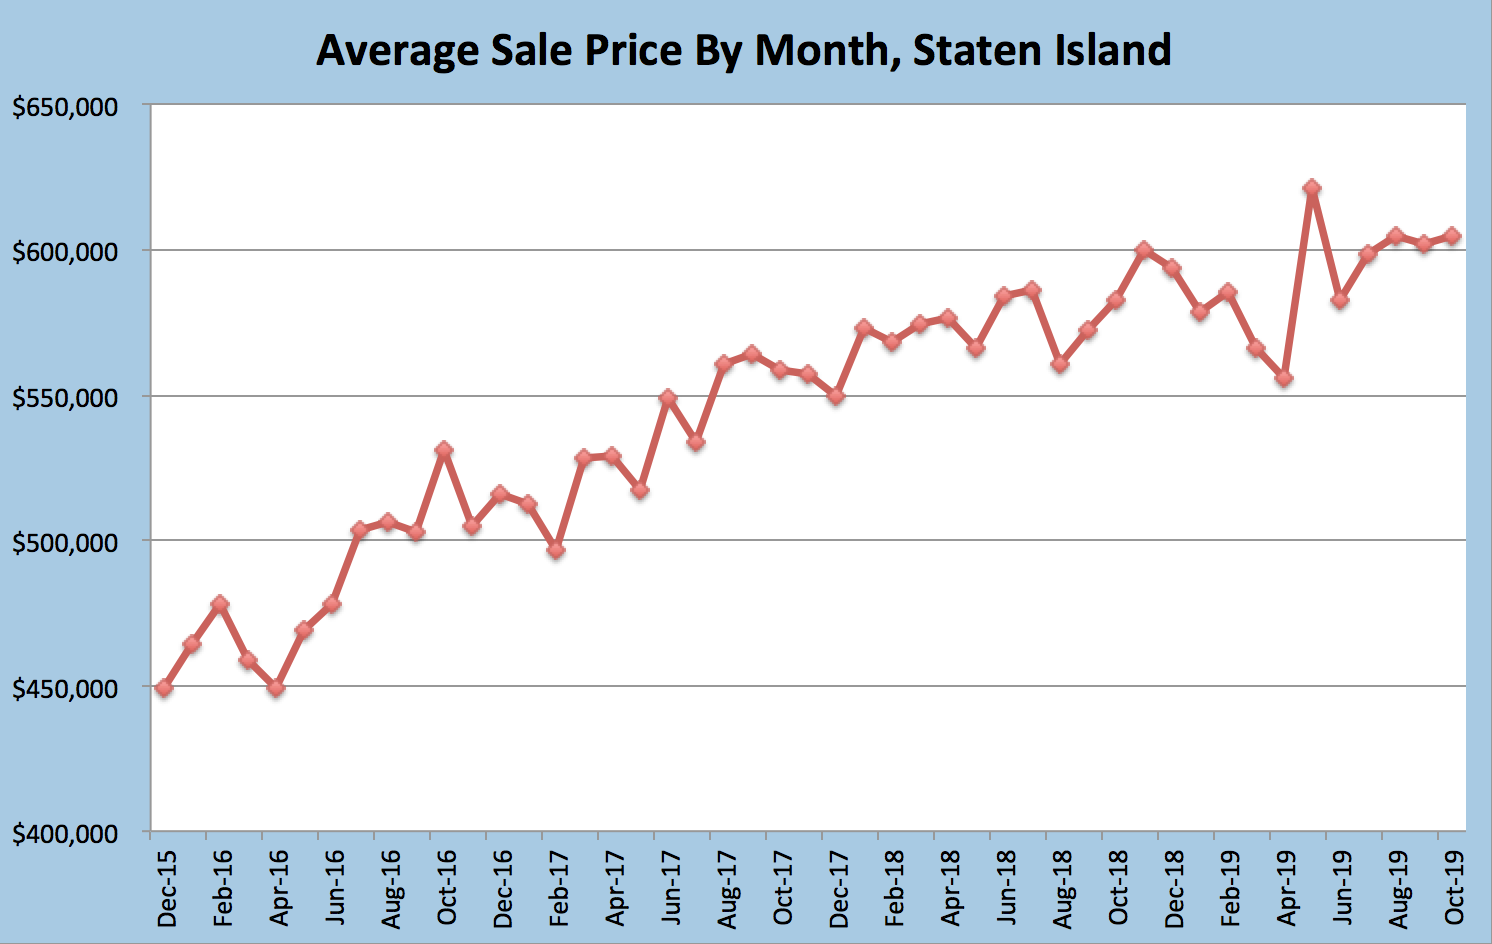
With Thanksgiving around the corner, we now have all data for the full month of October. The average home sale price hit $598,198. This is down from August’s record high of $604,717, but not significantly. For four straight months now prices have hovered around $600k. However, average sale prices are up by 2.3% since October of last year.
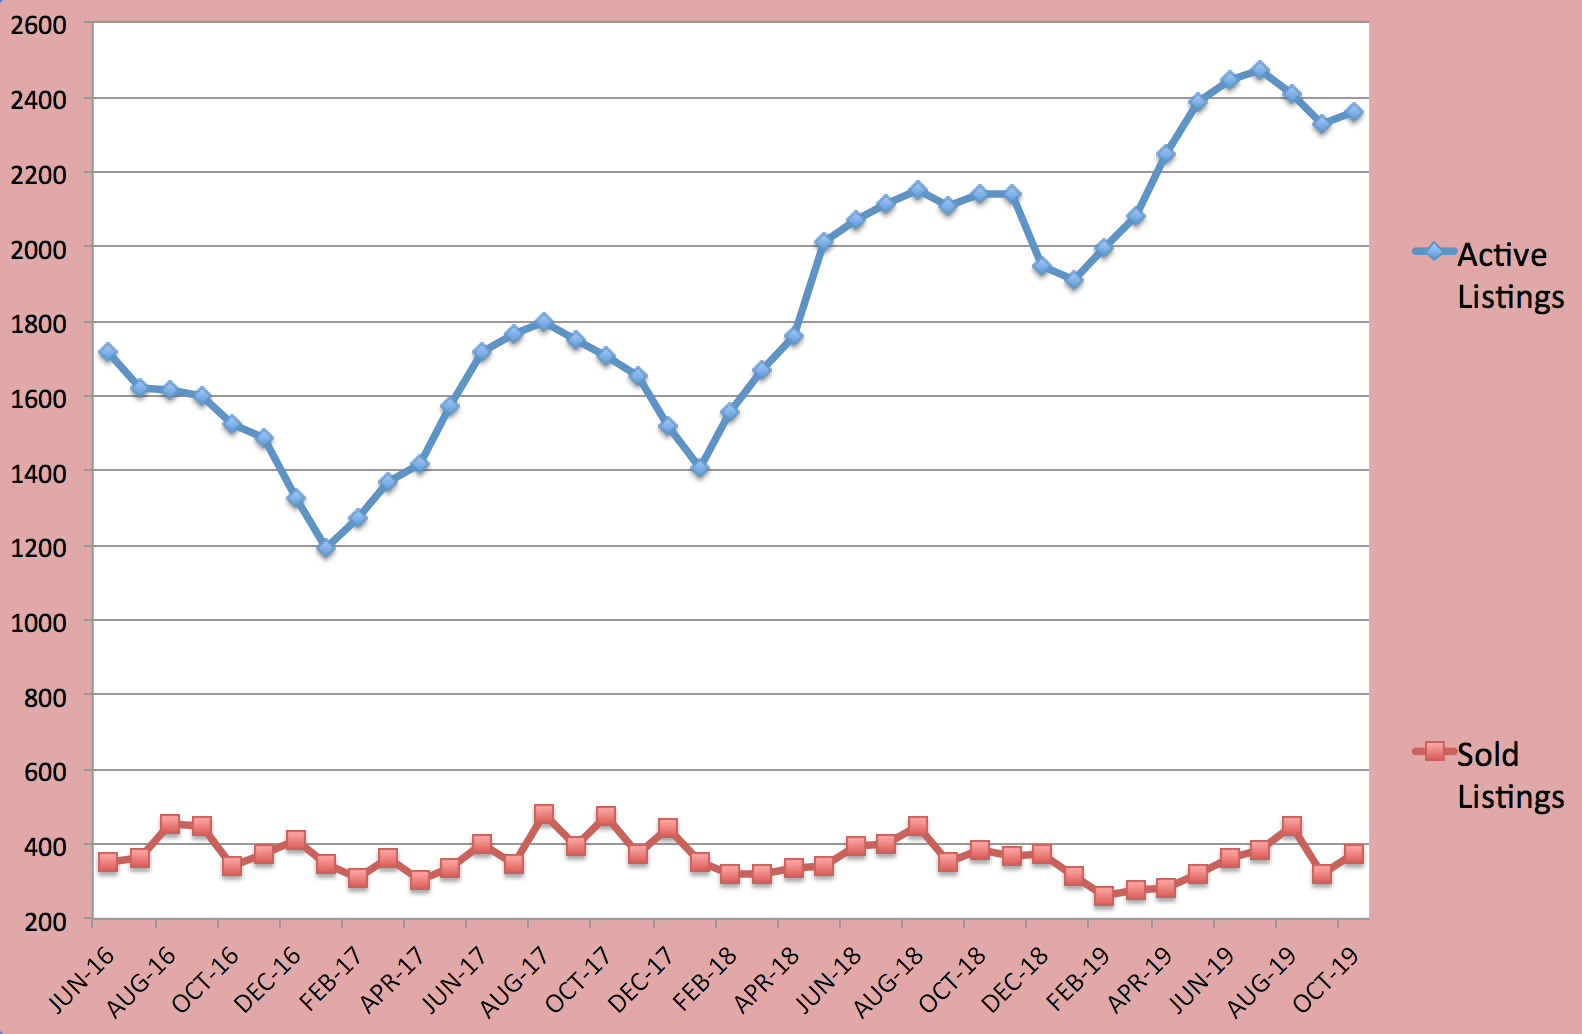
Housing inventory up too. Active listings rose 10% over last year, from 2,141 to 2,354. This is significant, especially considering there were only 1,707 homes for sale two years ago. Homeowners might be coming to grips with this though. New listings in October totaled 611, almost unchanged from 607 one year ago. This means homeowners are not rushing out in droves to sell their homes, for whatever reason that might be.
In conjunction, homes are also taking longer to sell. The average home now takes 100 days to sell. Since the beginning of 2019, this number has remained high. Sales are also down too. 379 homes sold in October. That is 5% less than last year’s 389, and 22% less than the 477 from October 2017!
 It is easy to see why. The average active list price is $717,309. Why are these listings active, or more importantly still active? Simply put, this figure is pie in the sky! It is 17% higher than the sale price, which is pretty significant when we look at homes worth over a half-million.
So if you want your home to sell take your emotions out of the equation and price it right! Ask your realtor to pull up comparable properties (aka comps) in your neighborhood. You will be looking at recent sales. Pricing in the same ballpark will help you avoid the pain of watching your home sit on the market with no offers.
Buyer’s Market? Seller’s Market?
Pundits and realtors alike tend to throw around the labels “seller’s market” or “buyer’s market.” A seller’s market happens when many buyers are seeking homes and the seller is in control. A buyer’s market happens when the supply exceeds demand; that is, the buyer has more choice and can make more demands.
 There are a few problems with this. Chief among them is that such labels are too simple. Inventory is up 25% from two years ago. Logically we would assume this was a buyer’s market because home seekers have more choices. But with sale prices up since last year, the higher inventory has not favored buyers by bringing prices down.
Another problem is that with prices so high, average salaries have not ballooned to such ridiculous heights. This makes it impossible for the average family to avoid the average home. According to the 2017 American Community Survey, Staten Island’s median household income is around $78,034. This brings in about $6,500 per month before taxes. Staying within the recommended 30% budget for monthly housing, this family would be able to afford a $1,950 mortgage. A $600,000 house could easily exceed $3,000 per month. How is that a true buyer’s market??
It is difficult to tell where prices will head, even though “experts” want to be right. But we can assume by the rising inventory that buyers have pulled back some and that prices, while higher than last year, rose more slowly than in 2017. We should not expect a wild price jump in the next few months. At least not a permanent one.