Staten Island Market Snapshot: Year In Review

Happy new year! As we enter a new decade, we now have a full year snapshot of what happened in 2019.
There’s a lot to talk about! We’ll be taking you through indicators of market health from the last few years, so in case you get lost, we’ve summarized the data into “takeaways” at the end of each section.
2019 Home Price Trends
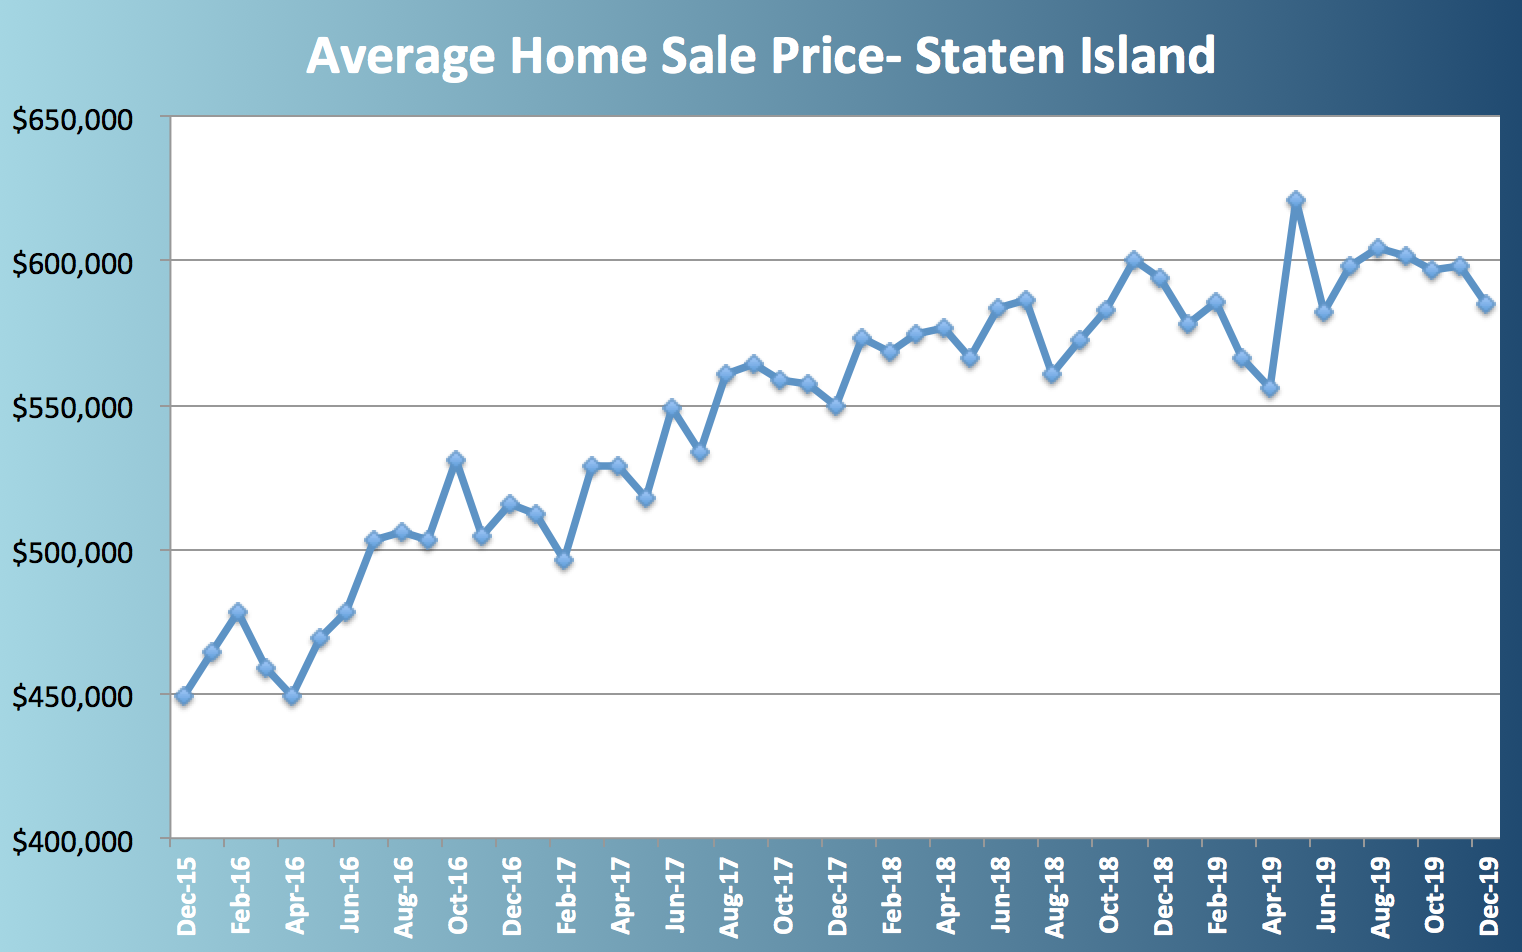
Monthly price trends experienced some pretty big dips and valleys over the past year. The lowest home sales took place in April when home prices dipped to $552,054. On the higher end, the average home sold for $621,047 in May. After a jump of nearly $70,000 in one month, prices fell right back down again to $582,507 in June.
Because of these big fluctuations from month to month, we combined each of the 12 months from 2019 to come up with one average figure. Last year’s average home sale price comes in at $588,705. In 2018, home sales averaged $579,172. Both yearly averages are on par with our most recent monthly from December. The average home today will sell for $584,695.
The takeaway: Year over year home sale prices remain about the same for the last two years. We did have a record-breaking price spike to $621,047, but it was short-lived and has come back down. We can therefore see that while prices rise and fall, home values have not changed noticeably over the past two years.
 2019 Inventory Trends

Besides home sale price, another item of note is housing inventory. New listings and monthly sales vary by the season, with winter activity being the slowest. Hence we won’t be using averages here. Let’s start by comparing December 2019 to December 2018. New listings last month (256) were down over the prior year (275), while sales were up (393 compared to 373). However, total inventory is still higher than December 2018.
December is typically the slowest month for new listings and sales. With the sample size being so small, a better picture emerges once we look at total inventory for the year. We ended the decade with 2,024 homes for sale in Staten Island. The average for the entire year was 2,263, while 2018’s average came in at 1,926.
The takeaway: More homes are for sale now than they were during 2018. Rising inventory has helped keep prices from rising since buyers have more selection. Listing activity slowed down over the last two months, however, when compared to the tail end of 2018. If this trend continues and inventory steadily falls, prices may creep up again.
Listing Price Trends
When a house hits the market, rarely does it actually sell for the initial amount. Homeowners are optimistic in the beginning and list their home for the highest price they feel is realistic. Because so much emotion is attached to their own home, a homeowner will often value it higher than it is worth. Once weeks or months go by with no offers, reality sets in. Price reductions are very common during the selling process.
Once the home does finally sell, we use what’s called the Sold-to-List ratio to find how closely the sale price came to the list price. Rarely does a home sell for the full asking price. The higher the number, the healthier a market is for sellers. For every month of 2019, the average Sold-to-List ratio was under 97%. But for 2018, most months broke 97% with a high of 97.4%. In 2017, Sold-to-List was as high as 98.4%.
Even one percent is significant in such an expensive market. 1% of $600,000 is already a $6,000 loss. Two years ago, the same house would have fetched up to $13,800 more.
The takeaway: Homes sold for only 96.1% of list price in December. In 2017, this figure cracked 98%. While one or two percentage points might sound small, the decreased Sold-to-List ratio has formed a trend. Sellers are accepting lower offers for their homes.
 Mortgage Trends
Another steady trend throughout 2019 was consistently low mortgage rates. Interest rates were on the rise during 2018 and experts were predicting the 30-year rate to surpass 5%. However, the real estate market slowed down on a national level last year. Sales have been down across the country after years of rising prices. When this happens, banks encourage home buyers with lower interest rates in order to keep the business coming.
The experts were thrown a curveball when mortgage rates averaged only 4% through 2019. For much of the year, the average 30-year fixed mortgage could be obtained for around 3.7%. Just like the Sold-to-List ratio we discussed above, a single percentage point will amount to thousands of dollars in the long term. In the case of a mortgage, this easily amounts to tens of thousands over a 30-year term.
Along with a fairly robust economy, this could explain the relative health of the market today despite rising home prices. Historically even 4% is extremely low. In the 1980’s the year rate reached over 20%! Mortgage rates in 2020 so far come in around just 3.8%.
The takeaway: Mortgage rates today remain at historic lows. After getting a bump in 2018 to around 4.5%, they came back down to 4% for 2019. This shows us that buying activity has slowed down and mortgage banks continue to offer homeowners a good deal to stimulate demand. Home values have plateaued over the last year as the housing supply (inventory) kept rising. These low mortgage rates may be all that’s keeping them from falling.